This week witnessed one of the largest selloffs in the market since 2011. CNBC couldn’t have been more giddy. Perceived fear and panic equal increased ratings. And television news is NOT about relevant information. It is about ratings.
Even our own local meteorologist tweeted about the selloff on Monday:
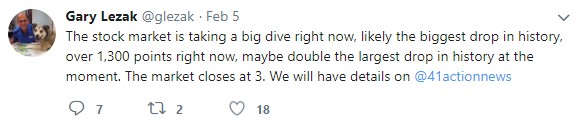
Proving that meteorologists should stick to the weather. What Mr. Lezak fails to understand is that 1,300 points is not even close to the “biggest drop in history” if you are talking about what really matters: percentage change. The Dow Jones Industrial Average closed down 1,175 points on Monday, which may sound like a lot to a weatherman but only amounted to a 4.6% drop. Certainly nothing to sneeze at, but the biggest drop in history?! Not even close. Not even in the top 100!
A little more perspective . . .
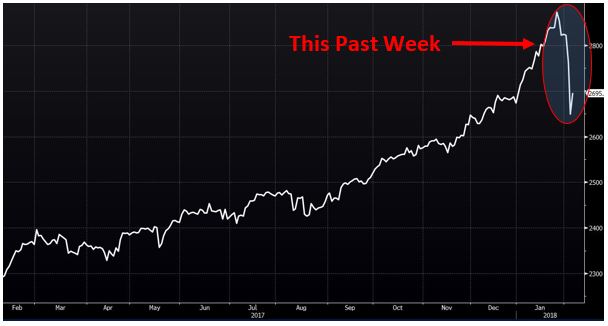
Looking at the chart of the S&P 500 for the past year, the recent selloff looks brutally ugly.
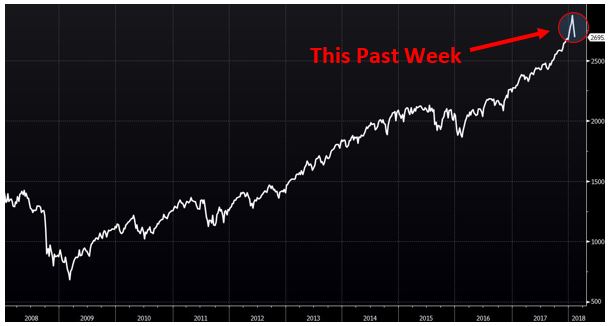
But in the past eleven years it’s barely a blip on the radar.
Thanks to some of the longest stretches of low volatility, investors have been conditioned to expect a slow and steady climb in their account values. But that’s more the exception, not the rule.
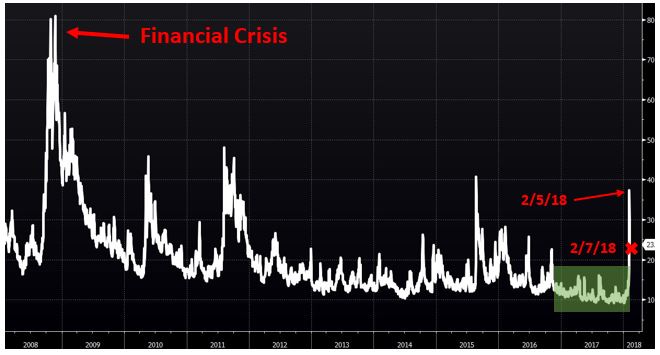
The chart below tracks volatility (the VIX Index) since 2007. The green shaded area in the bottom right corner highlights how volatility sat at record lows for all of 2017. With only a short-term perspective, the spike on Monday (2/5/18) is frightening. However, it’s nothing like the calamity of the 2008–2009 Financial Crisis, when volatility was off the charts. Recent volatility, while unusual, is nothing to get too excited about . . . yet.
The stock market has been on a rocket ship for the past two years and we are into the ninth year of a bull market. Profit taking is to be expected and, frankly, long overdue.
The interesting thing is what sparked the profit taking. Here is the culprit:
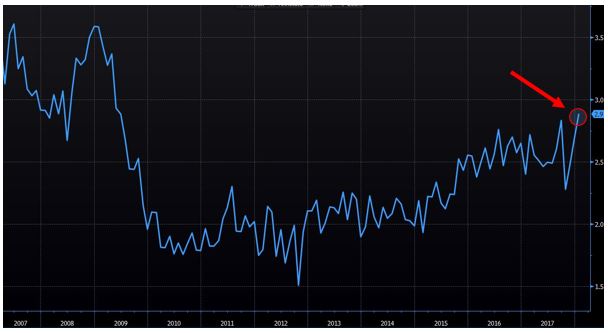
This chart shows the year-over-year growth in wages for the average American worker. On Friday, wages showed signs of life, increasing 2.9% over the past year. (The previous spike in late 2017 was due to Hurricane Harvey’s effect on the labor market and should be ignored.)
Annual wage growth of 2.9% is not exciting, but it’s still the best we’ve seen since 2009.
Wage growth typically results in higher inflation. The Fed is terrified of runaway inflation, and in an attempt to keep it in check they will “tighten” by hiking short-term interest rates faster than planned, which then increases the cost for companies to borrow and will be a headwind to the stock market. So good news is bad news. The economy shows one small sign of accelerating growth (higher wages) and the stock market sells off. Go figure.
What is important to remember is that this wage-growth number from last week is just that. ONE NUMBER! There may be arguments that we are late in the economic cycle (one of the longest in U.S. history) and accelerating growth will precipitate the beginning of the end, but we are not speculating after the release of ONE data point. Economic conditions are nothing like they were in 2008. Not even remotely. The economy is NOT ready to implode. What happened this past week was a long overdue correction in valuations.
________________________________________________________
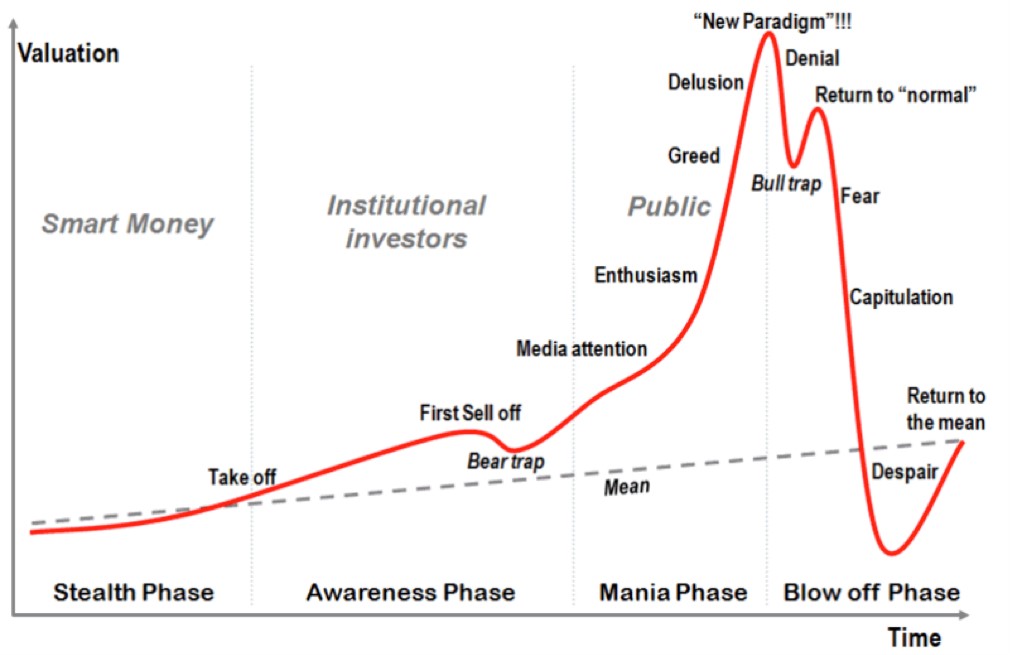
If you want to see how greed, fear, and FOMO (fear of missing out) affect asset prices, look at the graph below. It maps out the psychology of asset bubbles.
If you own Bitcoin, you may not like this chart . . .
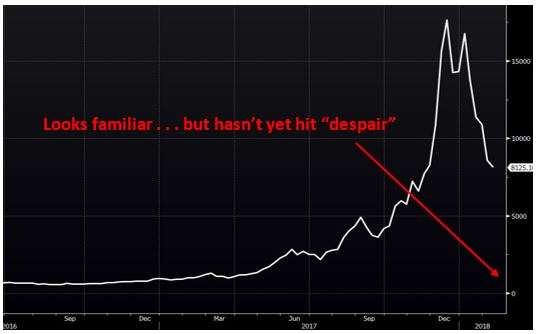
Two months ago, we said:
We view Bitcoin’s performance as a speculative frenzy fueled by FOMO (fear of missing out). People are piling in based on the hope they can sell it to someone else in the future at a higher price, and because they are afraid to miss out on becoming an overnight millionaire.
We continue to hold that viewpoint. Classic asset bubbles such as Dutch Tulips in the 1600s and Dotcom stocks in the late 1990s exhibited similar behavior, but tulips and dotcom stocks still exist today. Cryptocurrencies, in their current form, may not even exist ten years from now!
This information is provided for general information purposes only and should not be construed as investment, tax, or legal advice. Past performance of any market results is no assurance of future performance. The information contained herein has been obtained from sources deemed reliable but is not guaranteed.
This information is provided for general information purposes only and should not be construed as investment, tax, or legal advice. Past performance of any market results is no assurance of future performance. The information contained herein has been obtained from sources deemed reliable but is not guaranteed.